Loading...

Azure Quick Links

Azure Cloud Projects

Azure Sentinel

Deploy Microsoft Sentinel with a Log Analytics workspace, connect VMs via AMA, enable detections and playbooks (including an RDP brute-force email notification), simulate an RDP attack, query logs for detection, automate PowerShell command detection, deploy PowerShell logging to all VMs, and optionally use a GitHub playbook to block an Entra ID user..

Task Details

1. Create Azure Sentinel and Logs analytics workspace.
2. Connect Virtual machine to logs analytics workspace using AMA connector in Sentinel portal.
3. Configure prebuilt Analytics rules in sentinel.
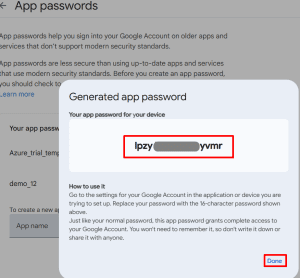
4. Create a playbook that automatically emails the administrator when an RDP brute-force is detected.
5. Simulate RDP brute force attack.
6. Query failed login events in the Log Analytics workspace to detect potential RDP brute-force attacks.
7. Automate response using a scheduled query rule to detect PowerShell command execution.
8. Deploy automated PowerShell logging on all VMs in the subscription.
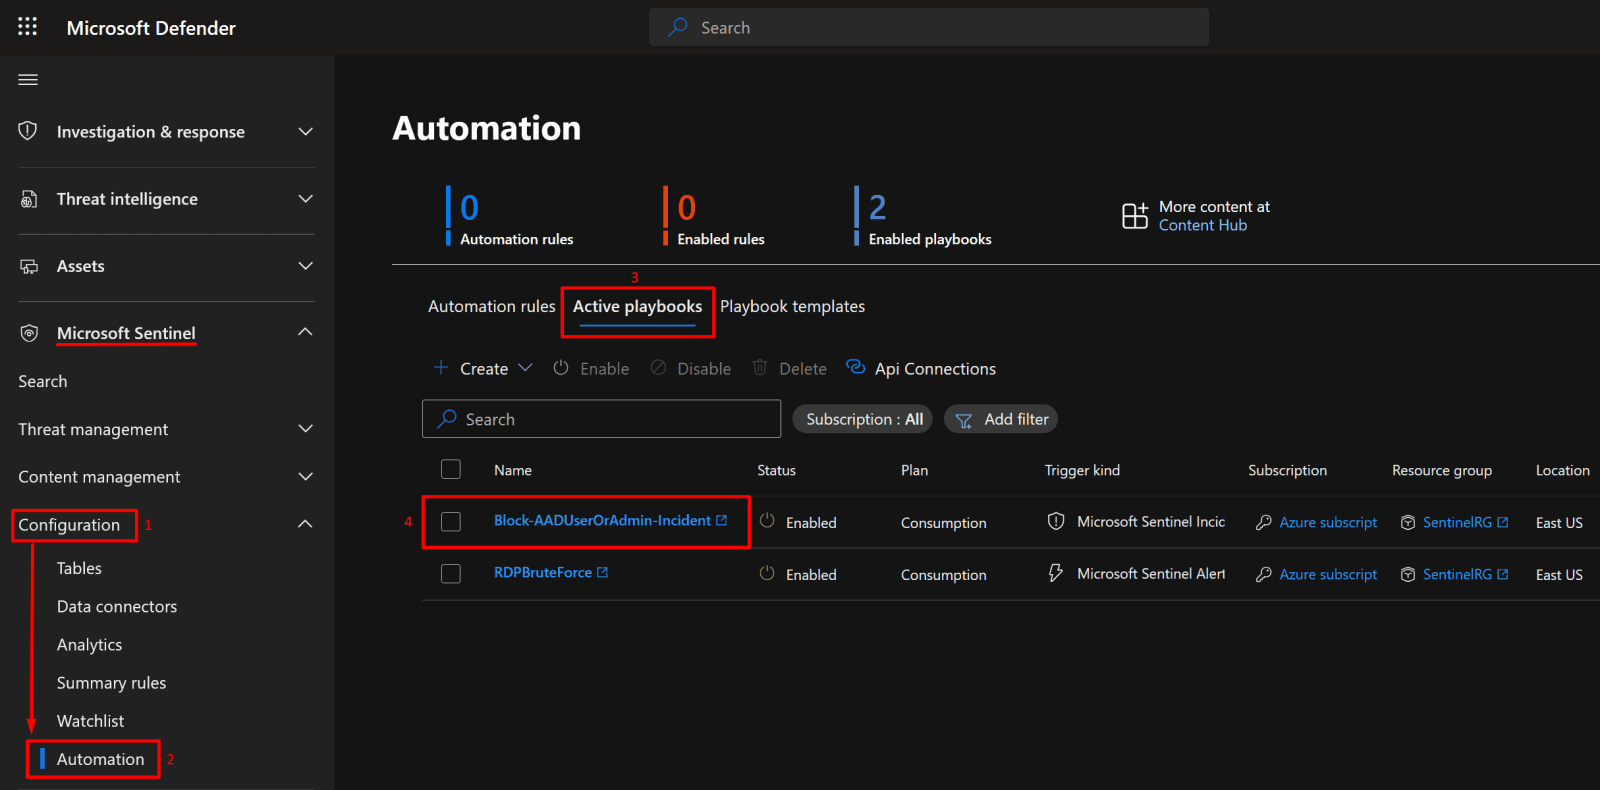
9. Bonus: Use playbook template from Github to block EntraID user.

*

Steps

Create an Azure Sentinel and Logs Analytics workspace.

Azure Sentinel is a cloud-native Security Information and Event Management (SIEM) and Security Orchestration, Automation, and Response (SOAR) solution that collects, analyzes, and responds to security events across your environment.

Log Analytics Workspace is the data storage and analysis foundation for Sentinel,  it stores logs from connected resources and enables you to run KQL queries for threat detection and investigation.

*

1. In the Azure Portal search bar, type Sentinel and then click Create.

*

2. Create a Logs Analytics workspace for Sentinel.

Note: Sentinel will automatically enable a 31-day free trial for your workspace, allowing you to ingest and analyze data at no cost during this period.

*

3. Fill in the Basics tab:

  • Subscription: Select your subscription.
  • Resource Group: Choose your resource group (or create a new one).
  • Name: Enter a name for your workspace.
  • Region: Select your desired region.

Click Review + Create.

*

4. Add Sentinel to a Log Analytics workspace.

  • Go to Microsoft Sentinel in the Azure Portal.
  • Click on the Log Analytics workspace you created earlier.
  • Click Add to enable Microsoft Sentinel for that workspace.

*

Connect the virtual machine to the logs analytics workspace using the AMA connector in the Sentinel portal.

Connect AMA connector in Sentinel portal.

1. Microsoft has moved many Microsoft Sentinel features, like certain connectors or dashboards, into the Microsoft Defender portal.

On the Sentinel page, click on "Click here to go to the Defender portal."

*

Install Windows Security Events via AMA.

2. In Sentinel, go to Content Hub, then search for Windows Security Events via AMA.

  • Click "Install."

*

3. Confirm that the package was installed.

*

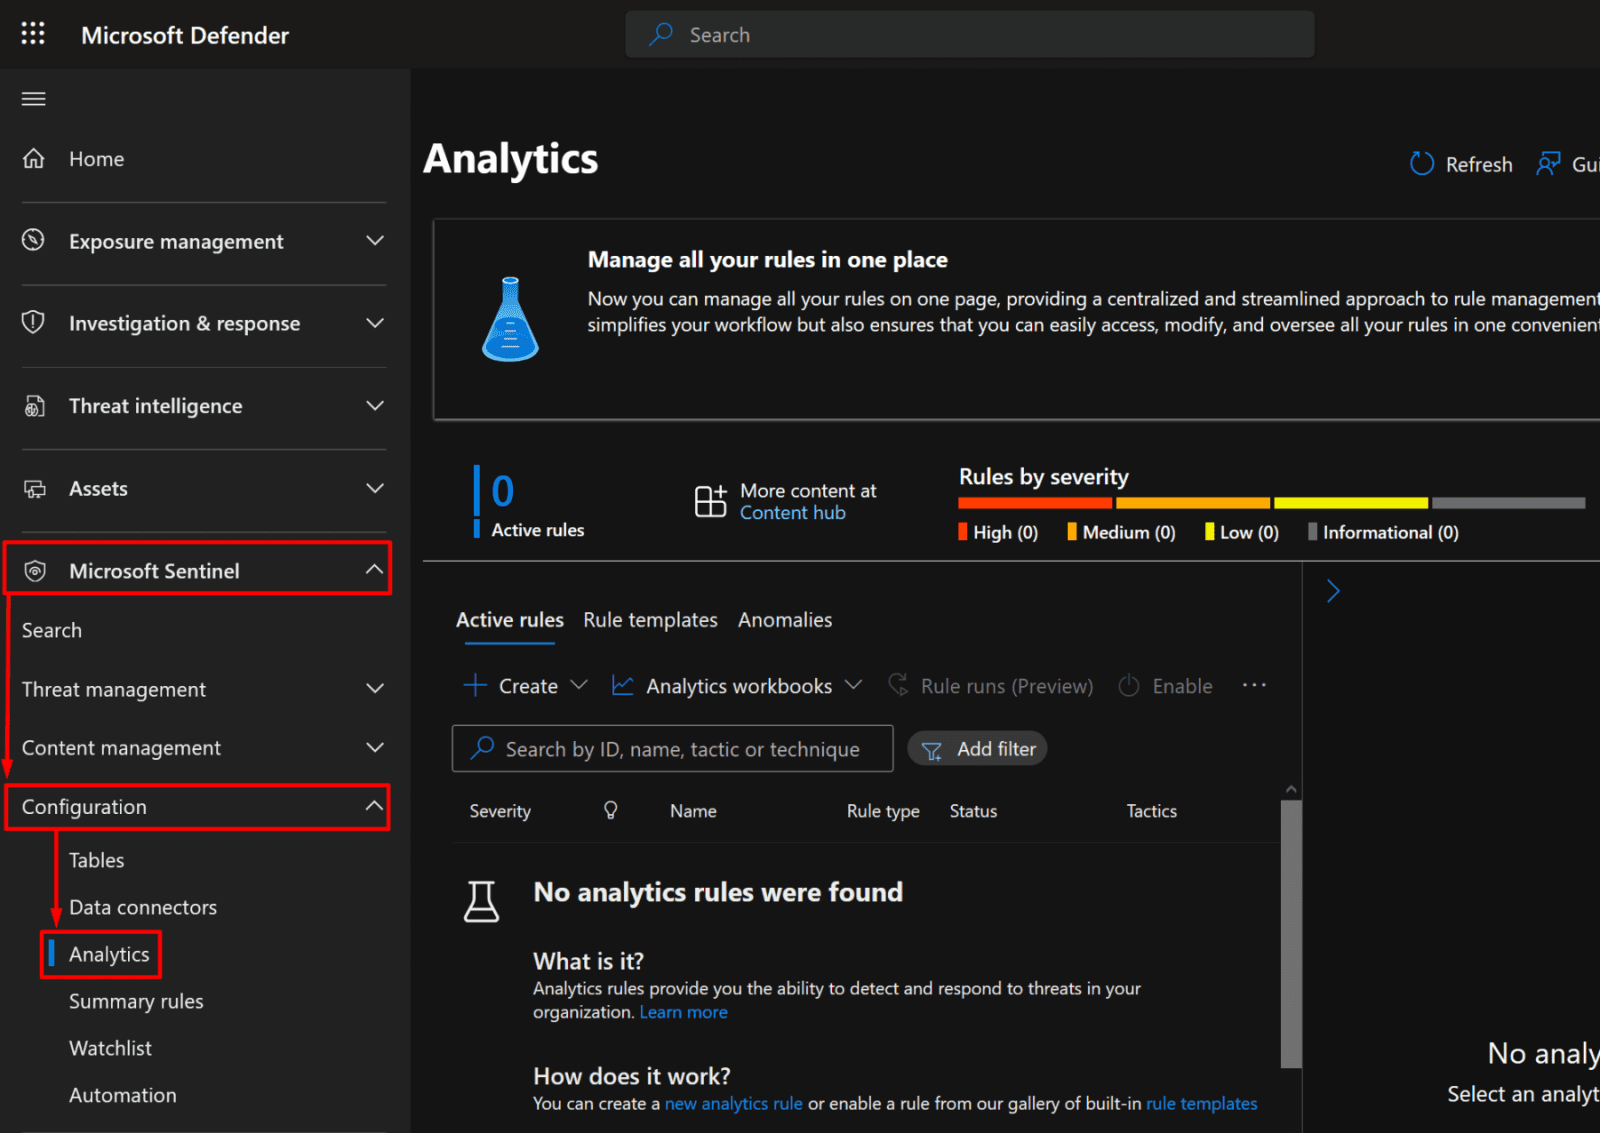
4. Once installed, the connector becomes available in:

  • Microsoft Sentinel → Configuration → Data connectors
  • Click on "Open connector page."

*

5. Click on "Create data collection rule" to enter the wizard.

  • Give it a name, and then choose your subscription and resource group.
  • Click "Next: Resources"

*

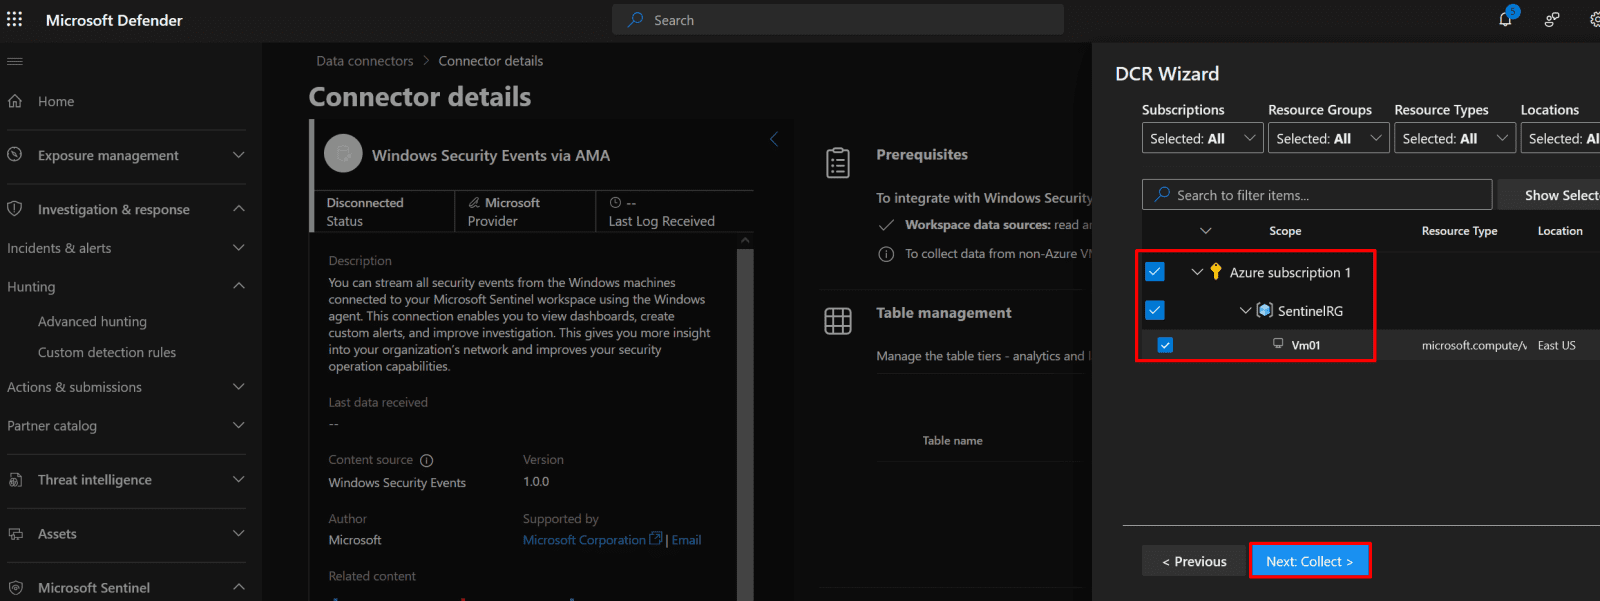
6. On resources page choose VM01, then click "Next: Collect"

*

7. On the Collect page, select “All Security Events”, then click Next: Review + Create, and finally click Create.

Note: This step creates a Data Collection Rule (DCR) that defines how security events are collected from your virtual machines.

Configure prebuilt Analytics rules in Sentinel.

1. Microsoft has moved many Microsoft Sentinel features, like certain connectors or dashboards, into the Microsoft Defender portal.

Click on "Click here to go to the Defender portal"

*

2. In the Microsoft Defender portal, go to:

Microsoft Sentinel → Configuration → Analytics

*

3. Navigate to Analytics → Rule Templates.

*

4. Enable the built-in analytics rules for:

  • Anomalous RDP Login Detections
  • Anomalous SSH Login Detection

Click on each rule, then select Create rule to go to the rule wizard.

*

5. Click Next: "Automated response".

*

6. On the Automation response page, you can view or create rules that automatically trigger actions when an analytics rule fires - such as running playbooks, sending notifications, or creating tickets.

  • Click Next: Review + Create.

Note: Repeat the same steps to create a second rule for Anomalous SSH Login Detection.


7. You can see 2 active rules that you created.


Create a playbook that automatically emails the administrator when an RDP brute force is detected.

Note: The playbook may block the attack if it includes automated mitigation steps (e.g., blocking the source IP or disabling the account). Otherwise, it will only send alert emails.

1. Give Sentinel permissions to run playbooks.

Click Configure permissions on the Automation tab, then select Sentinel and click Apply.


2. To create a playbook Go to Microsoft Sentinel → Automation → Create → Playbook (with alert trigger)


3. Configure the Basics Page.

On the Basics page:

  • Enter a name for your playbook (e.g., SendEmail_On_RDPBruteForce).
  • Select your Azure subscription and an appropriate resource group.
  • (Optional but recommended) Enable diagnostic logs in Log Analytics to monitor playbook executions and troubleshoot issues later.
  • Click Next: Connections
  • Click on Next: Review and Create
  • Click on Create playbook


4. After the deployment succeeds, click Close and navigate to your playbook to complete the configuration.

Note: You will be redirected to the Azure portal page for your playbook.


5. Open your playbook in the Logic App Designer.

You’ll see the first trigger:

  • Click Insert a new step (+ sign)
  • Click "Add Action."


Configuring SMTP.

6. Configuring SMTP in Logic Apps Designer.

Search for SMTP and click Send Email (V3)

Note: We use the SMTP connector because some mailboxes don’t support the REST API. SMTP allows sending alert emails reliably to any business email.

7. You can use a Gmail address to send emails from Logic Apps via SMTP, but there are some important differences and extra steps because Gmail blocks less-secure apps by default.

Get your Gmail app password.

If your account has 2FA enabled (highly recommended):
You must generate an app password in your Google account (normal password will not work).

Go to: Manage your Google Account → Search for: App Passwords

*

9. Give it a name: e.g demo_12

  • Click Create

*

10. Use this app password in Logic Apps SMTP connection and fill up the details.

Note: If no 2FA (not recommended): Gmail may block the connection unless you allow “Less Secure App Access” (Google is phasing this out, so app password is the better option).

  • SMTP server: smtp.gmail.com 
  • Port: 587 
  • Authentication: Basic 
  • Username: Your full Gmail address (e.g., yourname@gmail.com) 
  • Password: App password required if 2FA enabled 
  • Enable TLS: Checked 

When done with configuration, click Create new.

*

Set the email address that will receive the alert.

7. In the “Send Email (V3)” section, configure the From, To, Subject, and Body fields.

Note: After configuring the action, click Save, then manually run the trigger (or wait for the recurrence) to test that the Logic App works.

*

Simulate an RDP brute force attack.

1. On your local Kali Linux machine, execute the hydra utility to simulate an RDP brute‑force attack for testing purposes.

Run the following command:

Copy command:

hydra -t 4 -l admin01 -P /home/kali/Desktop/Wordlists/10k-worst-pass.txt rdp://52.190.xx.xx

*

Command explanation:

hydra – The tool being used; a popular password‑cracking/brute-force tool.

-t 4 – Sets the number of parallel tasks (threads) to 4. This makes Hydra try 4 passwords at the same time, speeding up the attack.

-l admin01 – Specifies the login/username to attempt. In this case, admin01.

-P /home/kali/Desktop/Wordlists/10k-worst-pass.txt – Path to the password list (wordlist) Hydra will use for brute-forcing. Here, it’s a list of 10,000 common passwords.

rdp://52.190.xx.xx – Specifies the protocol (RDP) and the target IP address (52.190.xx.xx).

*

2. As expected, an alert notification was delivered to the specified email address.

*

Query failed login events in the Log Analytics workspace to detect potential RDP brute-force attacks.

1. Go to Logs Analytics workspace.

In the Logs tab, use the following Kusto query to detect failed login attempts:

Copy command

Event | where EventLog == "Security" and EventID == 4625 and TimeGenerated >= ago(24h)
| extend Raw = tostring(EventData) | extend SourceIP = extract(@"<Data Name='IpAddress'>([^<]+)</Data>", 1, Raw)
| extend NetworkAddr = extract(@"<Data Name='NetworkAddress'>([^<]+)</Data>", 1, Raw)
| extend LogonType = extract(@"<Data Name='LogonType'>([^<]+)</Data>", 1, Raw)
| project TimeGenerated, Computer, SourceIP = coalesce(SourceIP, NetworkAddr, ""), LogonType, Raw
| take 20

Alert: Those 9 failed logins happened within 2 seconds, which is a strong indicator of a brute-force attack. Based on the event details (LogonType = 3, NTLM authentication from host kali) and the fact that only the RDP port (TCP 3389) was open, this activity almost certainly represents an RDP brute-force attack attempt.

*

Raw data output:

<DataItem Type="System.XmlData" time="2025-10-16T20:23:05.5775403Z" sourceHealthServiceId="22d666b2-abde-4bb2-b658-40be08550bb2"><EventData xmlns="http://schemas.microsoft.com/win/2004/08/events/event"><Data Name="SubjectUserSid">S-1-0-0</Data><Data Name="SubjectUserName">-</Data><Data Name="SubjectDomainName">-</Data><Data Name="SubjectLogonId">0x0</Data><Data Name="TargetUserSid">S-1-0-0</Data><Data Name="TargetUserName">admin01</Data><Data Name="TargetDomainName">-</Data><Data Name="Status">0xc0000234</Data><Data Name="FailureReason">%%2307</Data><Data Name="SubStatus">0x0</Data><Data Name="LogonType">3</Data><Data Name="LogonProcessName">NtLmSsp </Data><Data Name="AuthenticationPackageName">NTLM</Data><Data Name="WorkstationName">kali</Data><Data Name="TransmittedServices">-</Data><Data Name="LmPackageName">-</Data><Data Name="KeyLength">0</Data><Data Name="ProcessId">0x0</Data><Data Name="ProcessName">-</Data><Data Name="IpAddress">84.239.16.135</Data><Data Name="IpPort">0</Data></EventData></DataItem>

*

What can we understand from this snippet?

TargetUserName: admin01 - The attacker tried this account. 

IpAddress: 84.239.16.135 - Source of the attack (the attacker’s IP). 

WorkstationName: kali - Client machine name that attempted the login 

Status: 0xc0000234 - Account locked or login failure. 

LogonProcessName / AuthPackage: NtLmSsp / NTLM - Attempt used NTLM authentication. 

LogonType: 3 - Network logon (could be RDP, SMB, or NTLM over network). 

*

What can you do to prevent brute-force attacks?

Block 3389 on the internet: add NSG rule Deny * Source: Internet → Destination port 3389.

Allow only your IP: NSG rule Allow Source: <your-office-ip> → Dest port 3389 (higher priority).

Turn on Azure Bastion and disable public 3389.

In Windows: enable account lockout via secpol.msc (Account Policies → Account Lockout).

*

Automate response using a scheduled query rule to detect PowerShell command execution.

The scheduled query in this demo will filter Windows security logs to show only events where the process that started or executed is PowerShell (powershell.exe).

1. After saving a query, you can trigger Analytics Rules.

  • Go to Configuration → Analytics → Create → Scheduled query rule.

*

2. Define Rule Details

  • Name: Give your rule a descriptive name (e.g., Powershell Execution rule).
  • Description: Optional – explain what this rule detects.
  • Severity: Choose Low, Medium, or High depending on potential impact.
  • Tactics: Select relevant MITRE ATT&CK tactic(s) (e.g., Execution).

*

3. Set a scheduled query.

  • Under Set rule logic → rule query

Paste your hunting query.

SecurityEvent
| where EventID == 4688
| where NewProcessName endswith "powershell.exe"
| project TimeGenerated, Computer, SubjectUserName, CommandLine

Note: It will filter Windows security logs to show only events where the process that started or executed is PowerShell (powershell.exe).

Query scheduling:

  • Run query every, e.g., 8 hours.
  • Lookup period: e.g., 7 days (queries events in the last 7 days).
  • Trigger alert based on results:
  • Define how many results trigger an alert (e.g., greater than 0 failed logins).
  • Then click "Test with current data"
  • Click "Next: Incident settings"

4. Use default setting for everything else and click "Save"

*

5. The created rule will appear in the analytics dashboard.

Note: The rule monitors your connected machines (via the SecurityEvent table) and creates an alert each time PowerShell runs, depending on your rule frequency and threshold settings.

Important: To capture PowerShell command lines and script content, Windows must have PowerShell Logging turned on on Virtual machines.

*

6. Even with the automated rule in place, you can manually query PowerShell activity.

  • Go to Investigation & response → Advanced Hunting, then click Run query and paste the following:

Event
| where Source == "Microsoft-Windows-PowerShell"
| where EventID == 4104
| project TimeGenerated, Computer, UserName, CommandText = RenderedDescription
| sort by TimeGenerated desc

Alert – Suspicious PowerShell Activity:

The use of powershell.exe -ExecutionPolicy Bypass is a strong security red flag. Attackers commonly use this flag to bypass script execution restrictions and run malicious code.

Action: Monitor process creation events (Event ID 4688) and correlate them with PowerShell logs (Event ID 4104) to determine whether the activity is legitimate or malicious.

*

7. You can track automated incidents under Investigation & Response → Incidents.

*

8. Alternatively, you can run a query from the Logs Analytics workspace.

Confirm logs have been collected by log analytics.

Execute the following in the Logs Analytics workspace:

Copy command

Event
| where Source == "Microsoft-Windows-PowerShell"
| where EventID == 4104
| project TimeGenerated, Computer, UserName, CommandText = RenderedDescription
| sort by TimeGenerated desc

*

Deploy automated PowerShell logging on all VMs in the subscription.

1. Save the code as a .ps1 file, then upload it to Azure and run it.

*

Copy ps1 code

Note: You also could execute highlighted scripts individually on Windows VM's.

*

Bonus: Use the playbook template from GitHub to block the Entra ID user.

Azure Sentinel GitHub Repository

Microsoft’s Azure Sentinel GitHub provides prebuilt detection rules, workbooks, hunting queries, and Logic App playbooks. Using these resources helps accelerate deployment, follow best practices, and customize your SOC workflows. Always test imported content in a lab before production.

In this example we will block a user by using Block-AADUserOrAdmin playbook template.

1. Go to https://github.com/Azure/Azure-Sentinel and click on "Deploy to Azure"

*

Import the template from the Sentinel GitHub Playbooks folder.

Configure connectors to block/disable Azure AD users; ensure the Logic App identity has least-privilege permissions.

Add safeguards: only block on high-confidence alerts or require manual approval in production.

Test in the lab and attach to your Sentinel analytics rule action group.

Important: Automated user blocking is high-impact, validate in the lab first and log all actions.

  • High-impact: Can lock out legitimate users if misconfigured.
  • Test first: Validate automation in a lab environment.
  • Log actions: Record every block for auditing and troubleshooting.

*

2. You will be navigated to your Azure portal to configure custom deployment.

You will have to associate it with your resource group.

*

3. After creation, go to your Active playbooks to confirm that it exists.

As you can see, the status is enabled

  • Click the playbook.

*

4. It will redirect you to the logic app associated with the Block-AADUserOrAdmin-Incident playbook.

You can view the functions on the Logic App Designer blade.

Note: Review the logic app workflow tree for any validation errors. You can resolve them by supplying the required configuration details (such as connections, parameters, or permissions).

*

Conclusion

By completing this project, you’ve built a functional detection and response framework in Microsoft Sentinel — from connecting VMs and configuring analytics rules to automating alerts and PowerShell monitoring. This setup strengthens your environment’s security posture and lays the foundation for advanced SOC automation.

*

Written by Kirill.A - Azure & Cybersecurity Consultant at AntusNet

➤ Want more? Browse all our Azure implementation guides.

Need help implementing secure Azure solutions?

Contact us for a free consultation.

    error: Content is protected !!